Performance
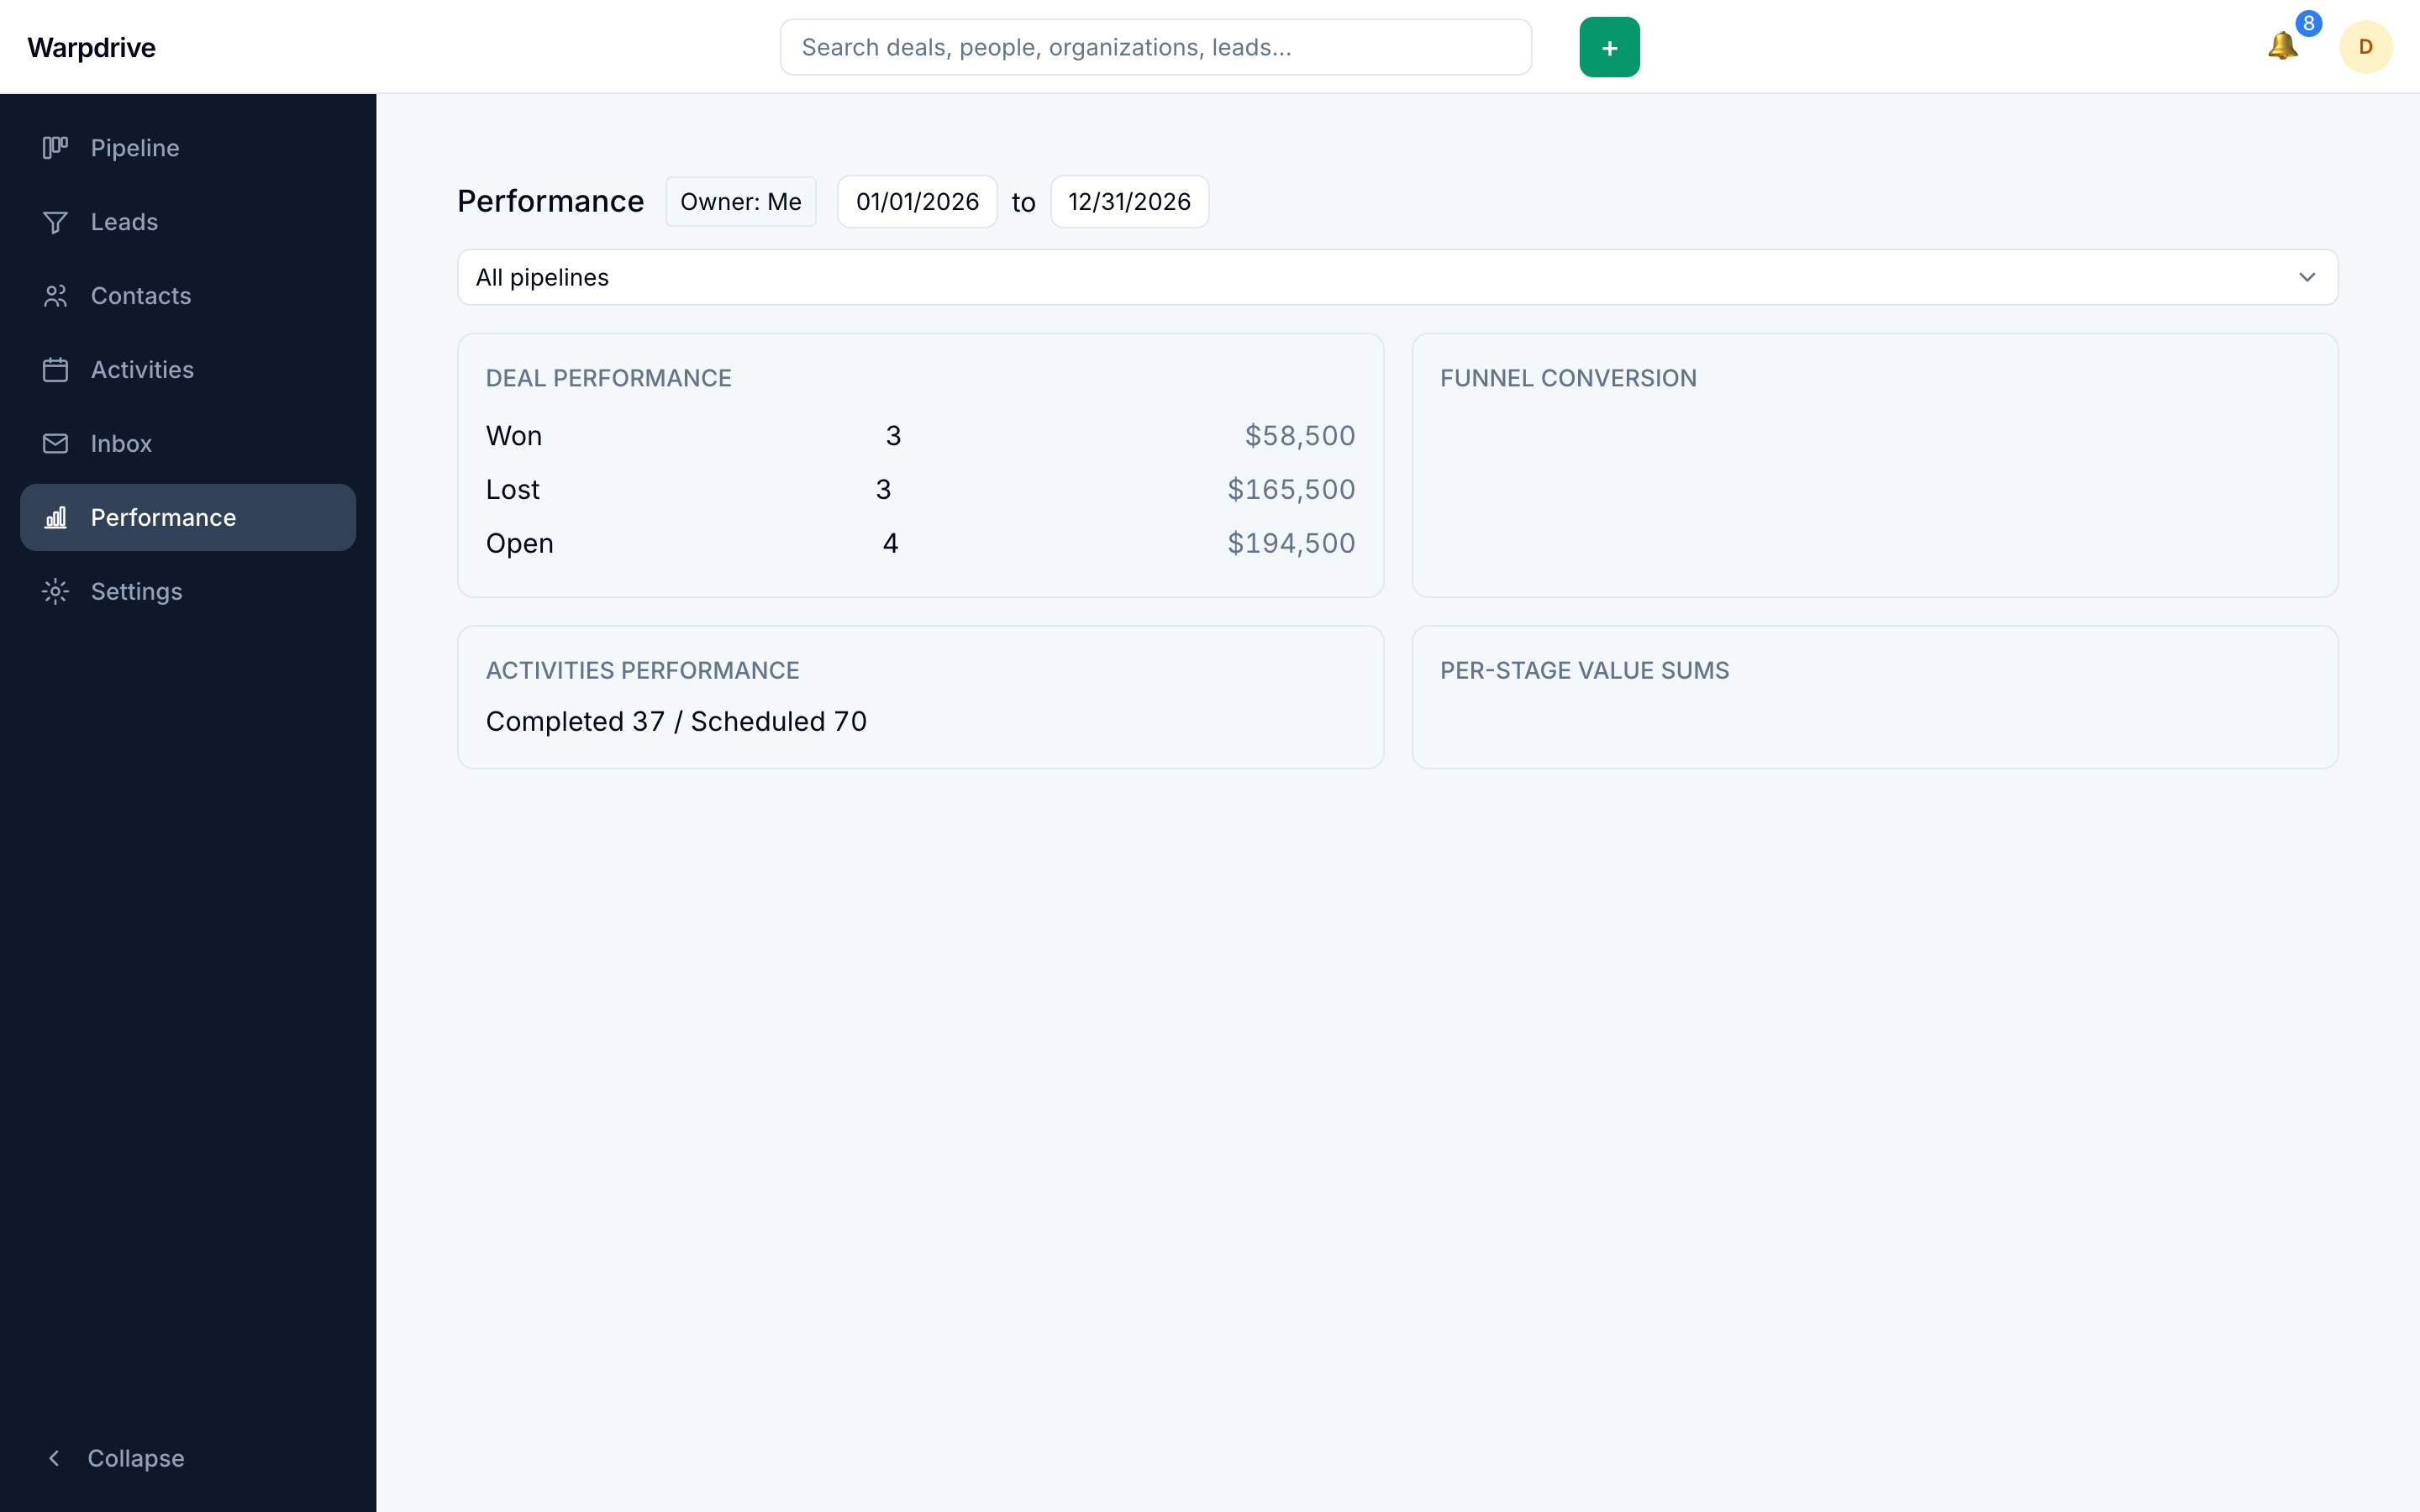
/dashboard is the Performance page: a scoreboard of sales metrics on top, quota
goals under it, and charts below.
Metrics
The scoreboard covers deals added, won, lost, and open, activities completed, added, and scheduled, win rate, average and median won deal size, and sales cycle length. Below it sit activities completed by type and lost reasons by count and value.
Each counter windows on the column that records its event: "Won" over a range means deals won in that range, not deals created in it that happen to be won now, and a completed activity counts by when it was completed, so finishing overdue backlog moves the number. Open deals are a snapshot, not windowed. Activities with no due date get their own count instead of vanishing, and a metric with no data renders a dash rather than a zero.
The funnel
The stage funnel is built from the deals' actual stage history, so it reports how far a cohort of deals got, with median days in stage, rather than where open deals happen to be sitting. A deal that moved forward and then back still counts as having reached the far stage.
"All pipelines" aggregates every pipeline you can see by stage position.
Quota goals
A goal names what is measured (for example deals won, by value or by count), who it applies to, and an interval, and carries a target. The Performance page shows each goal's progress for the current period as attainment plus pace: half the target booked a fifth of the way through the month reads as ahead, not as 50%.
Periods anchor on the goal's start date rather than the calendar, so a quarterly goal starting in February runs February to April.
Goals are managed on /settings/goals, behind the goals.manage permission.
Reading them needs no permission.
Numbers are visibility-scoped
Figures are computed with the same visibility rule as the records behind them. Records you cannot see do not contribute. A goal decides whose work counts toward the target, but your own visibility still decides which deals you may see behind the number.
Two people can legitimately see different totals for the same pipeline over the same period. That is the visibility model working as designed, not a reporting fault.
When reconciling a disputed number, compare as the same user, then check visibility groups.
Scope
The page is deliberately a summary rather than a reporting tool. Forecast views and configurable reports are out of scope for Warpdrive. For anything beyond these figures, query the database directly.